From 40 Seconds to 800ms: The GraphQL Mistake That Taught Me to Read Traces
How I went from "works on my machine" to a 50x performance improvement using Datadog, DataLoader, and a little humility.
It Worked on My Machine
Let me set the scene.
I had just finished building out getFilteredRings, a GraphQL query that powers our product listing page. Locally, everything was snappy. Filters applied instantly. Results loaded in under a second.
I deployed to UAT.
40 seconds.
Not a typo. Forty. Seconds.
I added timestamps. I stared at logs. I re-ran the query dozens of times. Locally? Still fast. UAT? Still broken.
The First Fix: Stop Doing Things One at a Time
When I finally started reading the code more carefully, My colleague noticed this pattern:
for (const item of items) {
await doWork(item);
}
This is a classic mistake. It's safe, but it's fully sequential. If each iteration takes 100ms and you have 200 items, you've already lost 20 seconds.
He switched to:
await Promise.all(items.map((item) => doWork(item)));This runs all the async work in parallel. It's a one-line change, but it cut the time in half.
Result: ~20 seconds.
Better. But still way too slow.
Better. But still way too slow. That's when it became my task to bring the latency down to milliseconds.
We didn't have observability in place to trace the issue, so we were relying on local testing. Everything worked fine locally the response was coming back within 1–2 seconds. To get better visibility into what was happening in UAT, we added observability to our microservice.
Opening Datadog (and Actually Looking)
At this point, I stopped guessing and started observing.
We use Datadog APM for tracing. Every request is assigned a trace ID, and every operation within that request is captured as a span — making it easy to see exactly where time is being spent.
I filtered for the GetCatalogRings query and opened one of the slow traces.
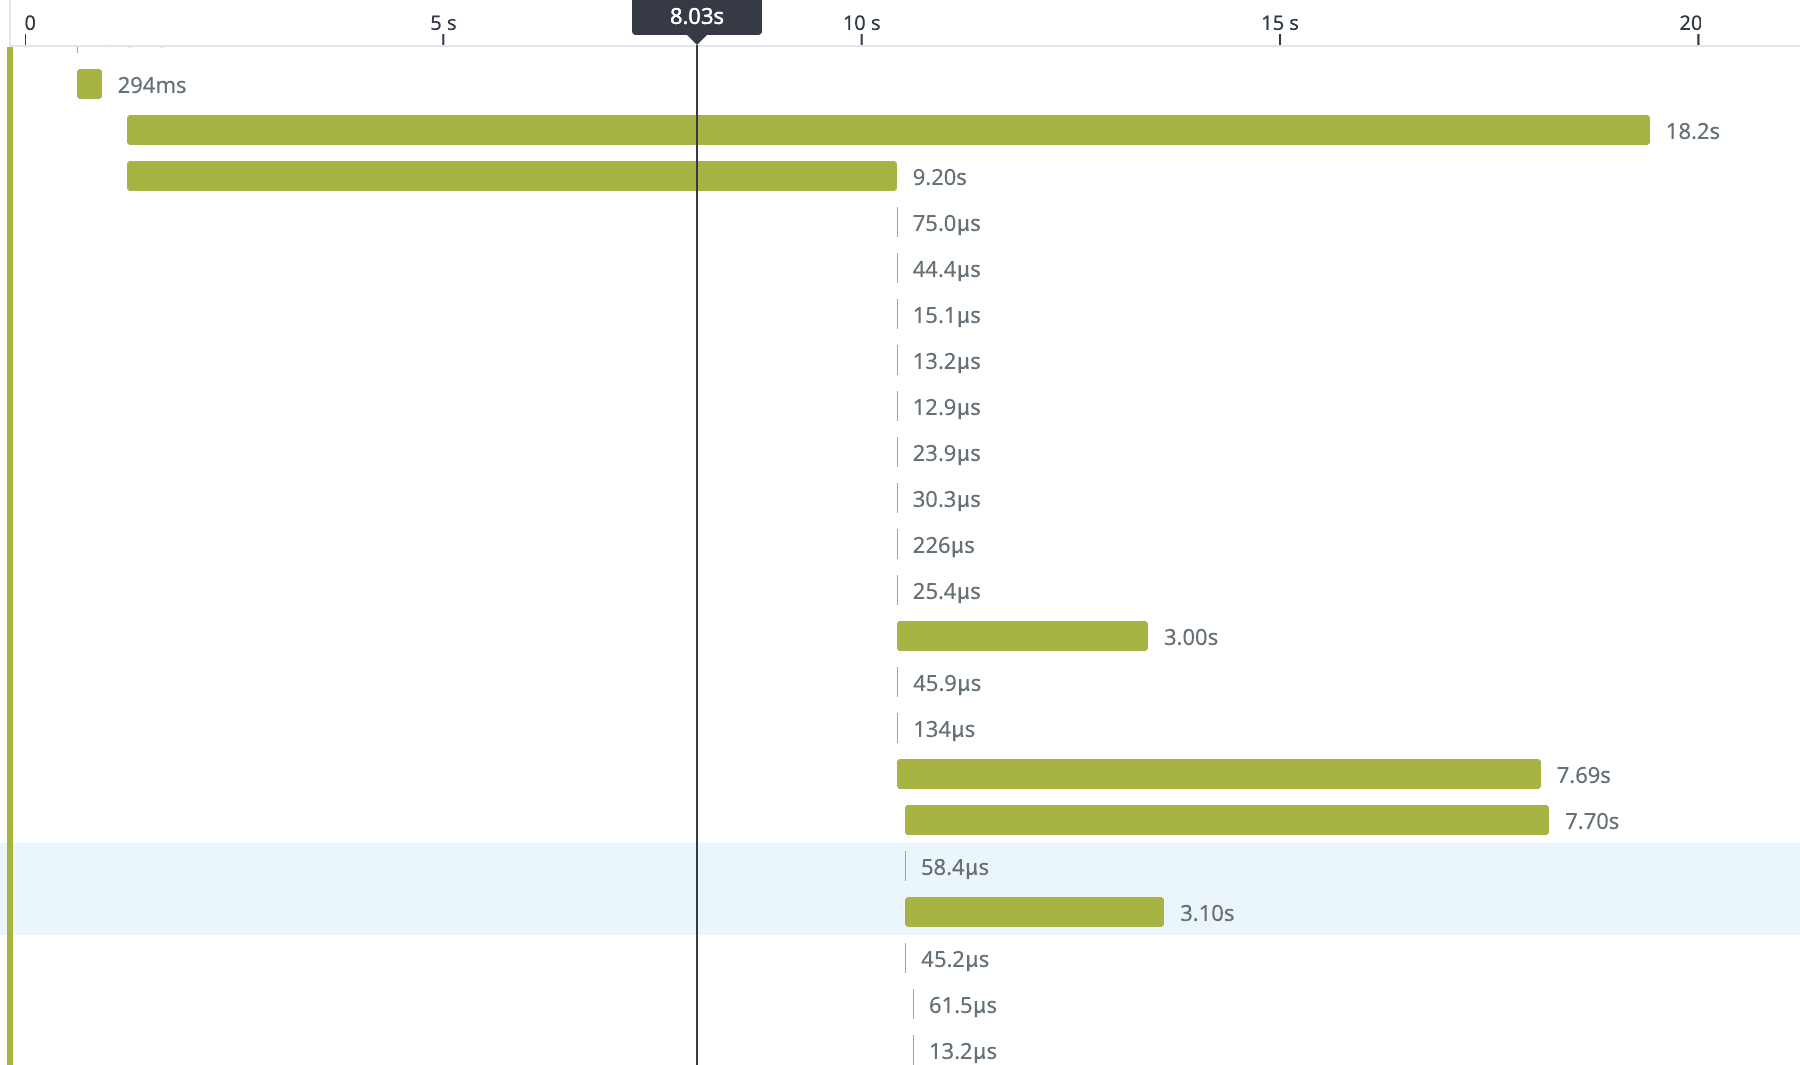
The numbers next to each span (5, 3, 2) told me how many times that resolver was called. That's when it clicked.
The N+1 Problem (In Context)
New to N+1?
If this term is new to you, here's a helpful reference: The N+1 Database Query Problem — A Simple Explanation
In GraphQL, nested fields aren't fetched automatically. Every field has its own resolver, and if those resolvers hit the database individually, you can accidentally create hundreds of extra queries.
I'd heard about the N+1 problem before — usually as a theoretical database warning.
This was the first time I watched it destroy a production endpoint.
- 1 query to fetch all rings.
- N queries to fetch metalQuality for each ring. One lookup per ring.
- N queries to fetch stoneShape for each ring.
Each ring only stored the IDs for its related data (metal quality, stone shape). So when GraphQL tried to resolve those fields, it had to hit the database again once per ring.
When the response included 500 rings, the breakdown looked like this:
| Query | Count |
|---|---|
| Fetch rings | 1 |
| Fetch metal quality | 500 |
| Fetch stone shape | 500 |
Each individual query was fast around 10ms. But 1001 of them? That's 10 seconds of pure overhead, not counting the joins and foreign key lookups involved.
And our schema had many joins. Rings linked to metal types, metal qualities, stone shapes, karats, suppliers, pricing tiers each one a potential N+1 trap.
A Quick Primer: How GraphQL Resolvers Work
GraphQL lets the client request exactly the fields it needs:
query GetCatalogRings($filters: RingFilters!) {
getFilteredRings(filters: $filters) {
  id
  name
  metalQuality {
    id
    name
  }
  stoneShape {
    id
    name
  }
  price
}
}
This is powerful. But GraphQL doesn't magically fetch nested fields like metalQuality and stoneShape. You have to write resolvers for them.
If each resolver does its own database lookup:
metalQuality: async (ring) => {
return await db.metalQuality.findOne({ id: ring.metalQualityId });
}
...then you get N+1.
In simple terms: for every ring, we were making a separate database call to fetch its metal quality.
The Fix: DataLoader
The key insight
DataLoader is one of the most effective tools for eliminating N+1 in GraphQL. Instead of each resolver fetching independently, they all register their IDs, and DataLoader batches them into a single query.
const metalQualityLoader = new DataLoader(async (ids) => {
const rows = await db.metalQuality.findByIds(ids);
const rowsById = keyBy(rows, 'id');
return ids.map((id) => rowsById[id]);
});
Now the resolver becomes:
metalQuality: async (ring, _, { loaders }) => {
return loaders.metalQualityLoader.load(ring.metalQualityId);
}
Same API. But instead of 500 queries, you get 1.
Before DataLoader
SELECT * FROM metal_quality WHERE id = 1;
SELECT * FROM metal_quality WHERE id = 2;
SELECT * FROM metal_quality WHERE id = 3;
-- … 497 more
After DataLoader
SELECT * FROM metal_quality WHERE id IN (1, 2, 3, …, 500);One More Thing: Stop Overfetching on the Frontend
While debugging the backend, I noticed something else: the frontend was requesting everything on the product listing page (PLP).
Product Listing Pages don't need full relational data they need just enough information to help users scan and decide.
The fix:
- On PLP. Request only the fields you need.
- On the product detail page (PDP). Fetch the rest.
This isn't just a backend optimization it's a user experience optimization. PLP loads faster. Users see products sooner. Conversions go up.
The Result:
After all optimizations:
| Stage | Latency |
|---|---|
| Before | 40s |
| After Promise.all | 20s |
| After DataLoader | 800ms |
Same endpoint. Same database. Completely different performance profile
50x improvement.
And the Datadog trace? Clean. No more giant bars hogging the waterfall.
What I Learned
- Works on my machine is a symptom, not a diagnosis..
- If you're awaiting in a loop, stop. Use Promise.all..
- Parallelism doesn't always mean faster. it means more pressure on your database.
- If you parallelize inefficient queries, you just overload the system faster..
- Observability is not optional.. Without Datadog, I'd still be adding timestamps and guessing. Traces show you exactly where time goes.
- N+1 hides in plain sight..
- PLPs should be fast. PDPs can afford more data. Don't treat them the same..
Debug Checklist (Steal This)
Performance debugging steps
- Instrument your endpoint with APM tracing (Datadog, New Relic, etc.)
- Find a slow trace and open the waterfall view
- Look for repeated spans same operation, many times
- Confirm N+1 by checking query counts or DB logs
- Add DataLoader for batched lookups
- Audit frontend queries - are you overfetching?
Final Thought
Performance bugs are frustrating because they're invisible. The code looks right. The tests pass. But under real load, everything falls apart.
The only way out is to stop guessing and start observing.
Tools like Datadog don't just show you what's slow they show you why. And once you see the problem clearly, the fix is usually obvious.